The Chrome DevTools are essential for developers using web technologies.
This set of tools, which we will detail later, is one of the reasons why many JavaScript developers stick with Chrome. Indeed, although other browsers (like Firefox) have similar features, Chrome's are very comprehensive.
Live HTML modification, access to network calls, SEO audit, etc., are just a small part of the features that DevTools offers.
Moreover, this toolbox is regularly enriched with new features, making it increasingly indispensable for developers.
So, how do Chrome DevTools work, which developers can't live without? The answer is in this article!
Presentation of DevTools
Chrome DevTools are presented as a panel that adds to the Chrome browser interface.
There are several ways to open it:
Using keyboard shortcuts:
Command + Option + i on macOS
Ctrl + Shift + i on Windows and Linux
By right-clicking anywhere in the browser and then clicking Inspect
Using the main Chrome menu:
Click on the Chrome menu button
Select More tools
Select Developer tools
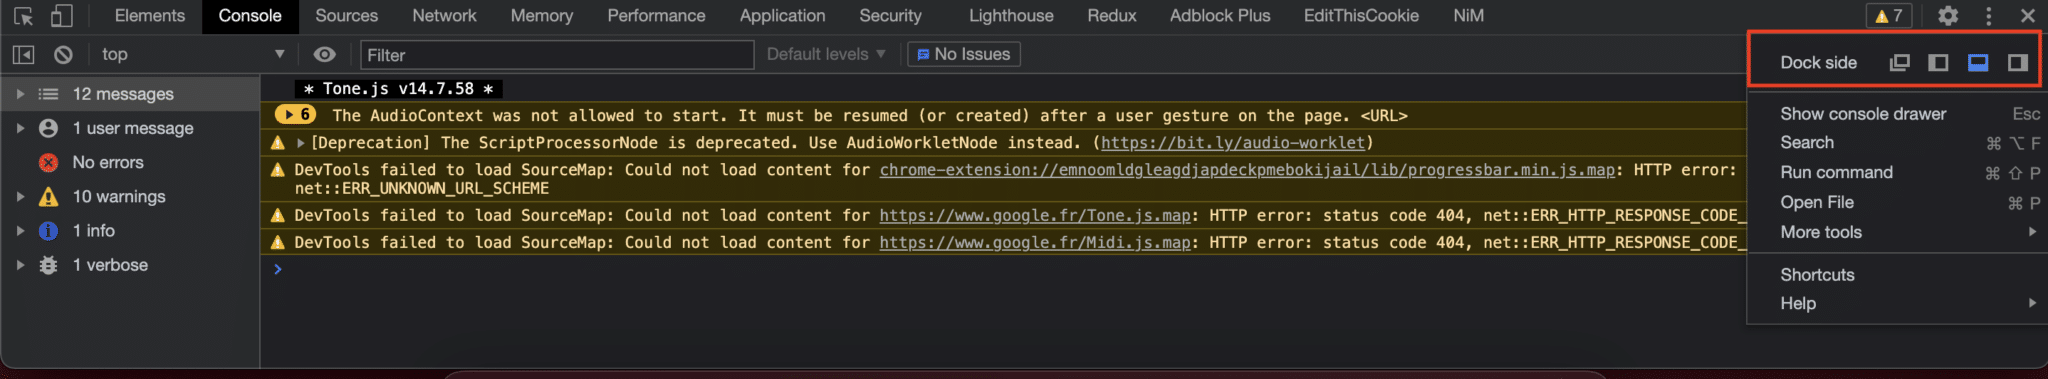
Once opened, this console is by default at the bottom of the screen, but it can be easily moved (to the left or right of the screen) or displayed in a new window by clicking here:
As you can see, this console has different tabs (Elements, Console, Sources, etc.) each representing a feature. These are the features we will discuss in the rest of the article.
Main Features of DevTools
Basically, Chrome DevTools have about ten features. But as we will see, behind each of these features are many other sub-features. It is also possible to add new tabs to this dock, making it even more powerful.
Let's go over the most used features of Chrome DevTools.
Elements
Let's start with the first tab, and one of the most used: Elements.
"Fake" DOM Modification
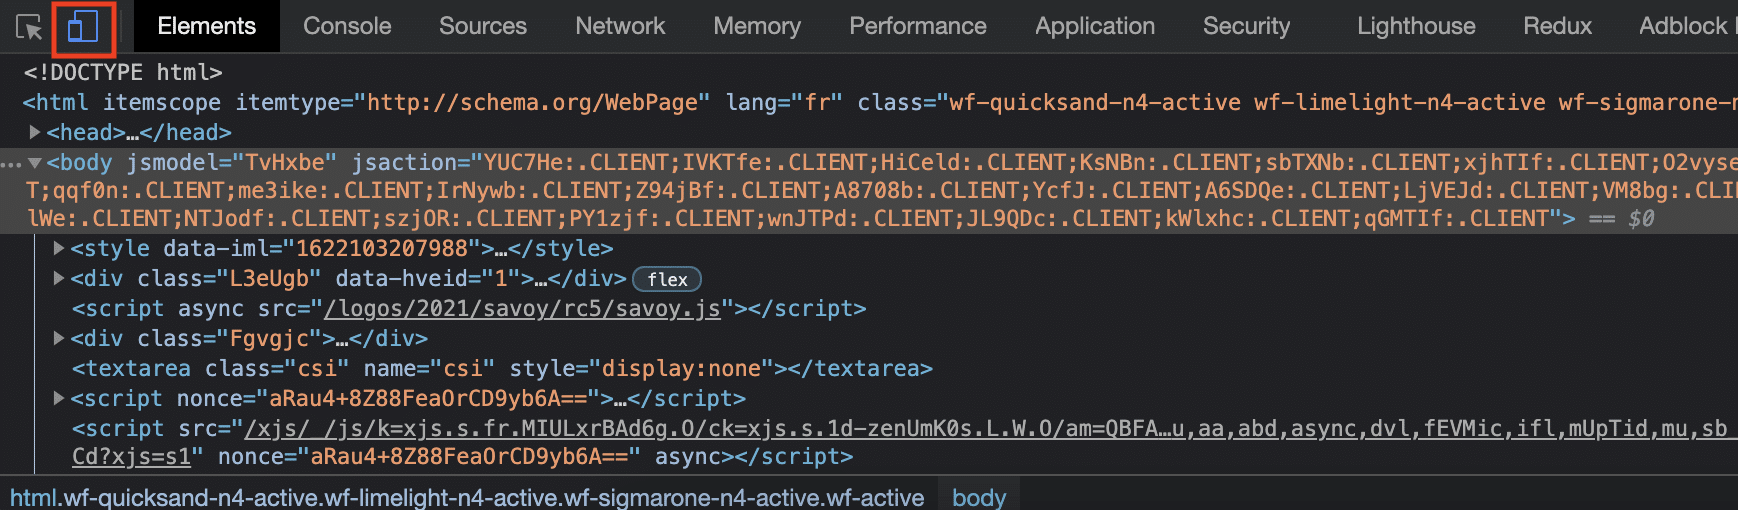
Elements allows us to access the entire HTML tree of the page we are on, as well as the CSS styles applied to these elements.
Even better, through this tab, we can perform what could be called an instant fake modification. That is, modify the HTML and CSS code on the fly and see the result on the web page in real time.
Of course, these changes do not persist, and if you refresh the page they will disappear. But it is very useful when you want to quickly test the modification of an HTML element, and even more so a CSS property.
Responsive Testing
The other main feature of this Elements tab is the ability to test the website under different screen sizes. To do this, just click here:
To see the site appear in a different screen size. We can change the device on which we want to see the page displayed, add, remove devices, change the portrait/landscape view, test offline mode, etc.
This feature is very often used by web developers when it comes to testing the responsiveness of a web page under different sizes, from large screens to small smartphones.
Some Tips
By right-clicking on an HTML element, a menu with different actions is displayed, including the ability to copy this content in different ways (element, outerHTML, selector, etc.);
You can simulate a state of a CSS class (hover, active, focus, etc.) to see what your code renders without having to perform any action on the page. To do this, click on the ":hov" above the panel displaying the CSS properties;
In these same properties, if you want to change a color, click on the small colored square to the left of the hexadecimal code. This will open a small window that allows you to find the exact color you need, but also an eyedropper that you can use to find the right color already present on the page!
Another very used feature in Chrome DevTools is obviously the console, essential for JavaScript developers.
It allows you to display a whole bunch of messages, for example:
Your code's syntax errors;
Server call errors (500 responses, etc.);
The different console.(log|error|warning|...) you have placed in your code.
But the console also allows you to type and execute JavaScript code live. While this may not seem very practical at first, it still has several uses. To access global variables you have declared, for one. But also to test small pieces of code manipulating the DOM (getElementById, etc.) and thus avoid having to make several attempts in your editor.
By clicking on the gear of this tab, you will see the options offered by this feature: keep the console logs (which normally disappear with each refresh), use autocompletion based on your history, etc.
In short, the console is extremely useful for JavaScript debugging, essential for web development.
Network
The Network tab is also very used. And for a good reason, it groups all the network calls that go through the browser. For example, it includes:
The loading of all scripts (CSS, JavaScript, etc.);
The loading of all images;
The flow exchanges (requests for user actions: login, form submission, etc.).
In each of these calls, you can access different information: the request headers, the request content, the response content, or the time it took for the request to complete.
Very useful especially for back or fullstack development, the Network feature also contains a somewhat hidden sub-feature that can be important: the ability to test the site with poor connections.
Typically, by clicking on the select box where "No throttling" is written, you can simulate a bad 3G connection and see how the site reacts. This allows you to measure the response time, both of the site as a whole and individually, on each network call.
Application
The next feature we will talk about is in the "Application" tab. Through this interface, you can access a whole bunch of data that will be less useful on a daily basis but is good to know about.
For example, if you need to manipulate databases and storage on the browser side, or access the various cookies that are stored, this is where you should go.
This is the case if, for instance, you need to manage localStorage or sessionStorage. These data will be accessible and modifiable from this tab of DevTools.
This is also where you can view any manifests and service workers, essential elements for the proper functioning of Progressive Web Apps (PWA).
Lighthouse
The last important feature we will cover here is Lighthouse.
It is one of the latest features introduced by Chrome in its DevTools. While it may seem completely useless to some, it is a feature that should be used when doing web development.
Lighthouse performs, to keep it simple, an audit of your site. Focusing notably on SEO, accessibility, and performance, Lighthouse analyzes your web page and gives you scores out of 100 in these different categories.
Even better, Lighthouse explains how to boost these different elements according to already defined best practices.
This allows you not only to get a precise idea of what is wrong with your site and what is hindering its SEO, but also gives you improvement tips to quickly fix these flaws.
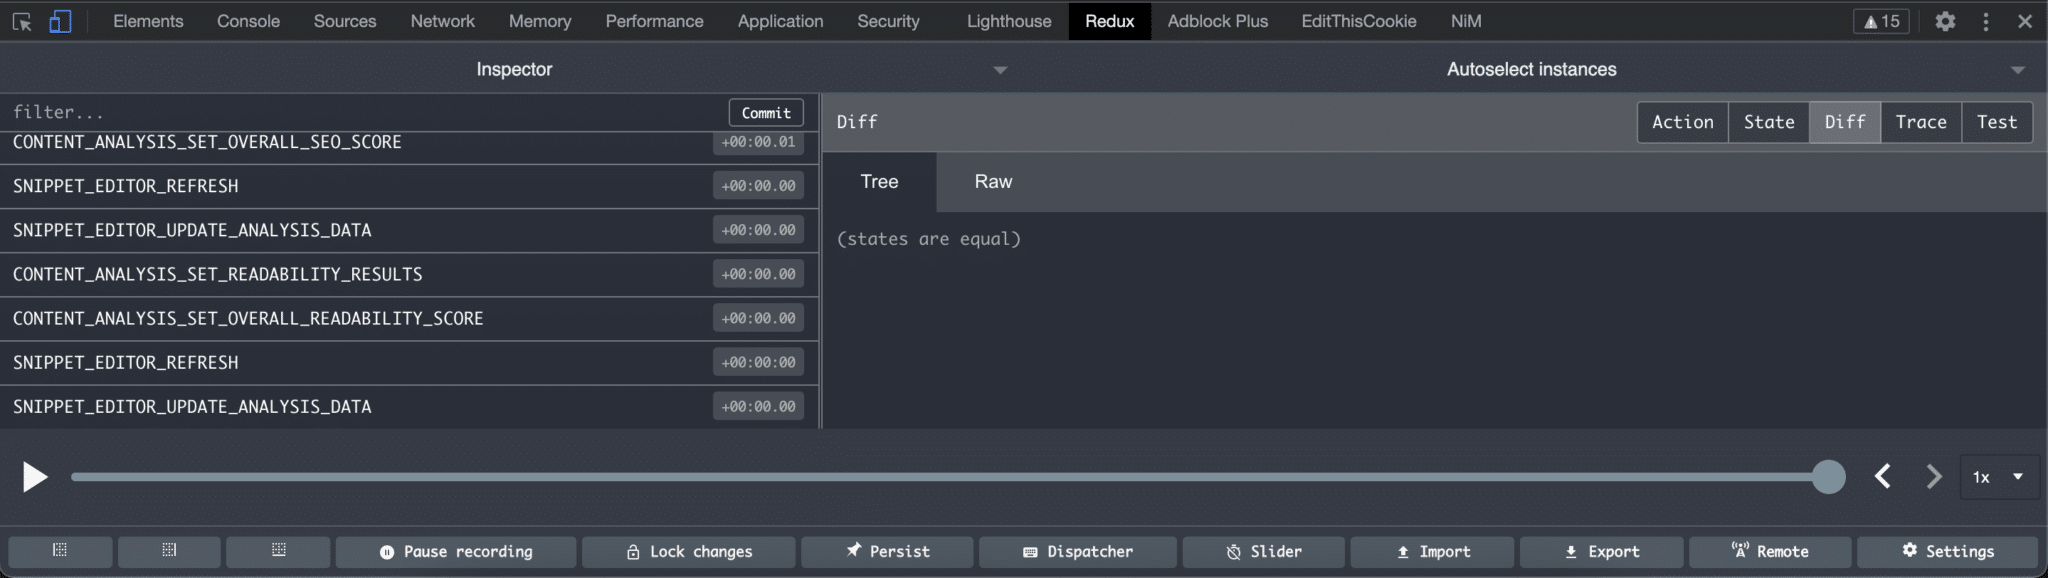
Using Other DevTools Extensions
It is also possible to use external DevTools extensions in addition to those already provided by Chrome.
If you are a front-end developer, for example, it is possible to install extensions to facilitate development (and especially debugging) when using certain libraries or frameworks. This is for instance the case with the Angular framework, which made a DevTools extension available.
Thus, Chrome's development tools are enriched with even more new features, allowing for more reliable development and easier debugging.
And if you want to try your hand at developing DevTools, Google has created documentation here.
Conclusion
I hope this article has helped you understand what DevTools are, which are the most important, and how to use them!
Keep in mind that this is just an introduction to Chrome DevTools; there are far more features and sub-features than those listed here. If you want to know more or have more specific needs, a few searches on the net will easily help you.
If you still have questions about DevTools and how to use them, the comment section is there for you.